Marketing can be hard to measure, but with HubSpot you have many ways to prove your value.
In this series we are discussing reporting best practices, as well as giving you our top picks for HubSpot reports for your dashboards. This article is the second in the series and is focusing on Marketing.
-3.png?width=1082&name=pasted%20image%200%20(5)-3.png)
Your Marketing Dashboard
Marketing departments have traditionally struggled to show their value in cold, hard numbers, but that’s where HubSpot helps you stand apart and showcase your value to your business.
Finding the insights in the data is our specialty, and here are eleven HubSpot reports we use to illustrate the work we’re executing, our performance, and to better our results over time.
1. Overall online performance
Visitors (number of people visiting your website), contacts (number of new contacts) and customers (number of customers) including the conversion rate.
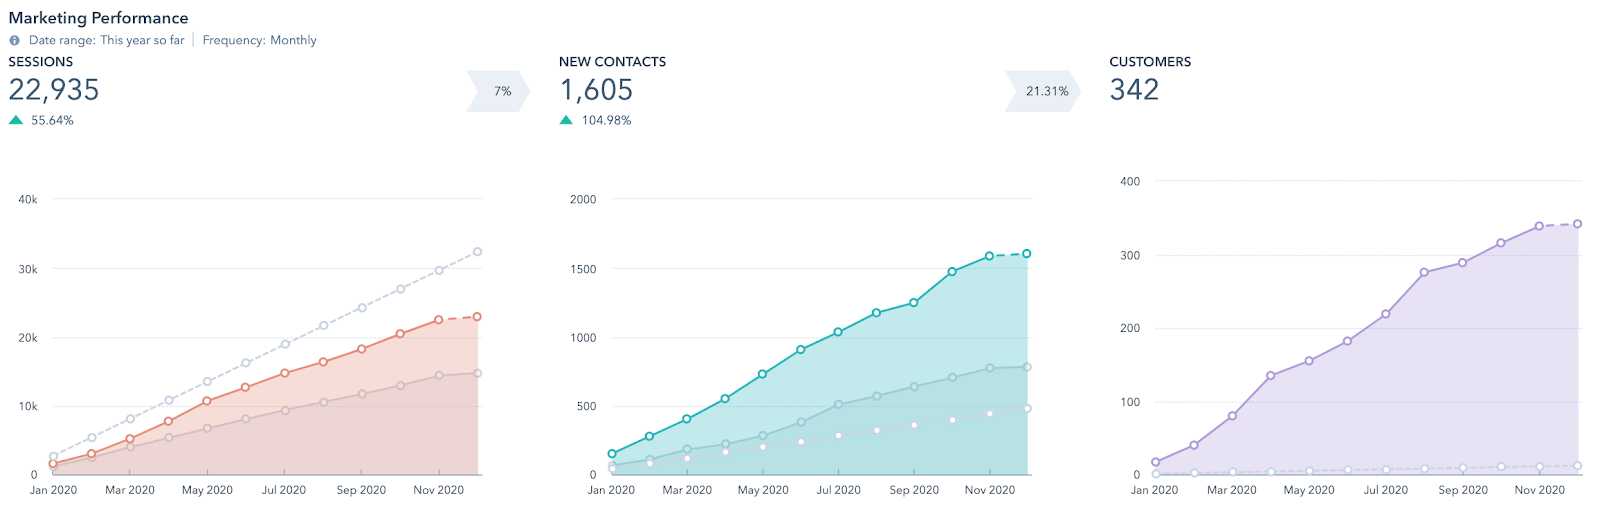
All data included is from imported test data for demo purposes
Benchmarks
- Visitor to contact conversion rate of 0.93%
- Contact to Customer conversion rate of 7.1%
2. Traffic Analytics report
Breakdown of each of the above (visitors, contacts and customers) into source segmented by organic, direct, paid, social media, paid social media, email, referral, other campaigns (UTM tracking) and offline. You are able to select the style of this and toggle between visitors, contacts and customers as well as conversion rates.
This allows you to understand which source is generating you the greatest volume of new contacts and customers. It is also an important measure for your digital activities including your SEO.
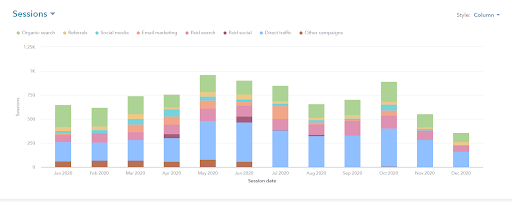 All data included is from imported test data for demo purposes
Benchmark
3. New contacts by lifecycle stage and original source breakdown
This report will show you which source is generating the highest quality leads based on where they are in the lifecycle stage. This will help you direct your digital strategy in the future to focus your efforts and budget on areas that are performing really well for you.
Further, segment this with the buyer persona to understand which of your personas are converting to customers.
-2.png?width=595&name=unnamed%20(1)-2.png) All data included is from imported test data for demo purposes
All data included is from imported test data for demo purposes
4. Contact Lifecycle stage with contact totals and conversion rates
This report is important to compare the current time period but also all time. Metrics should show the number of contacts in each of the lifecycle stages.
-png.png?width=731&name=unnamed%20(2)-png.png)
All data included is from imported test data for demo purposes
5. Landing Page performance by conversion
This report will assist you with understanding which content offers lead to the most sales. Coupled with campaign reporting and revenue attribution you are in a strong position to measure your most valuable marketing assets.
Metrics include views, submissions, new contacts and customers by individual landing pages.
-png.png?width=746&name=unnamed%20(3)-png.png) All data included is from imported test data for demo purposes
All data included is from imported test data for demo purposes
Benchmark:
- 20% view to submission conversion rate
6. Blogging/Article Performance by article
This report is important to establish which articles are performing well against their goals and which need to be optimised or if required, archived.
Metrics include the number of views, number of contacts created, CTR, blog dwell time, as well as social shares.
-png.png?width=720&name=unnamed%20(4)-png.png)
All data included is from imported test data for demo purposes
7. Email sent totals with engagement rates
This report will show you which emails are performing well and which require optimisation. This can be segmented by email type, for example, marketing, automated, follow-up, RSS, blog, or A/B tests
Metrics to include - emails sent, opened and clicked, email open and click rate, visits, contacts and customers from email, email health
-png.png)
All data included is from imported test data for demo purposes
Benchmarks (based on South Africa Industry, Trade & Manufacturing):
- Email open rate of 21.49%
- Email click-through rate of 1.8%
- Unsubscribe rate of 0.4%
- Complaint rate of 0.04%
8. Social Media engagement by platform
This report should highlight the engagement that is taking place on each platform at a high-level view and then important, the number of contacts and customers created by each social network.
Further reporting beyond the dashboard should include reporting per platform of follower growth, Engagement, Interactions, Visits to website, Contacts created, Customers.
-png.png?width=719&name=unnamed%20(5)-png.png)
All data included is from imported test data for demo purposes
Benchmarks on average monthly page growth in following
- Benchmarks as of October 2020
- Facebook +0.22%
- Twitter
- LinkedIn +0.02%
Benchmarks on page engagement
Benchmarks on average interactions
Benchmarks on average visits to website
9. Paid Media
This report needs to reflect the return on your investment, and not merely the vanity measures like number of clicks.
Metrics to include (segmented by campaign) are: cost per contact, ads attributed, number of customers, the amount spent by campaign, revenue by campaign and ROI
-png.png?width=763&name=unnamed%20(7)-png.png)
All data included is from imported test data for demo purposes
10. Website Performance
This is essential to maintain the health of your website and could very easily be a dashboard alone.
Important metrics on the dashboard are Page views per session, bounce rate, time on page, new vs returning sessions, visits by source, top pages by page view, affinity categories, in-market segment, behaviour flow, and demographics. This could be through both your Website analytics with the integration to Google Analytics dashboard as well as the Marketing dashboard.
-png.png?width=708&name=unnamed%20(8)-png.png)
All data included is from imported test data for demo purposes
11. Campaign reporting
This report is accessed through the strategy tab in Marketing or the report on all campaigns can be accessed under Reports | Campaign Analytics. If allows for a further deep-dive into the campaign elements and how they are performing in order to further optimise these.
-png.png?width=768&name=unnamed%20(10)-png.png)
All data included is from imported test data for demo purposes
The reporting functionality for marketing campaigns in HubSpot is incredibly powerful and can be used to drive your marketing decisions. For a full marketing reporting guideline click here.
In our next article in the series, we will be looking at the sales reports to power your sales team, managers and reps!
Sign up to receive the remainder of the series direct to your inbox!